
... typical errors & alarm levels!

A mid-sized network with Windows and Linux servers, a firewall, and Microsoft 365 generates thousands of log entries every day. No one reads them manually.
A Security Information and Event Management (SIEM) system centrally collects this data, normalizes it, and evaluates it based on rules so that the few events indicating a potential attack stand out from the mass.
Wazuh is an open-source platform that you can self-host without licensing costs. However, a Wazuh instance left unchanged after installation primarily generates noise.
Most deployments fail due to a lack of tuning and undefined processes that no one has established beforehand. Both can be planned before the rollout.
How Wazuh is structured
Wazuh consists of four components. The agent runs on Windows, Linux, and macOS endpoints, where it reads logs, inventory data, and file changes, then sends them to the Wazuh server. The active connection uses port 1514/TCP, while new agent registration uses port 1515/TCP.
The server decodes the events and checks them against the rule set. Matches are stored by the Wazuh indexer, a search and analytics cluster, and the Wazuh dashboard makes them evaluable in the browser. In version 4.x, Filebeat transports the alerts from the server to the indexer, by default over port 9200/TCP with TLS.
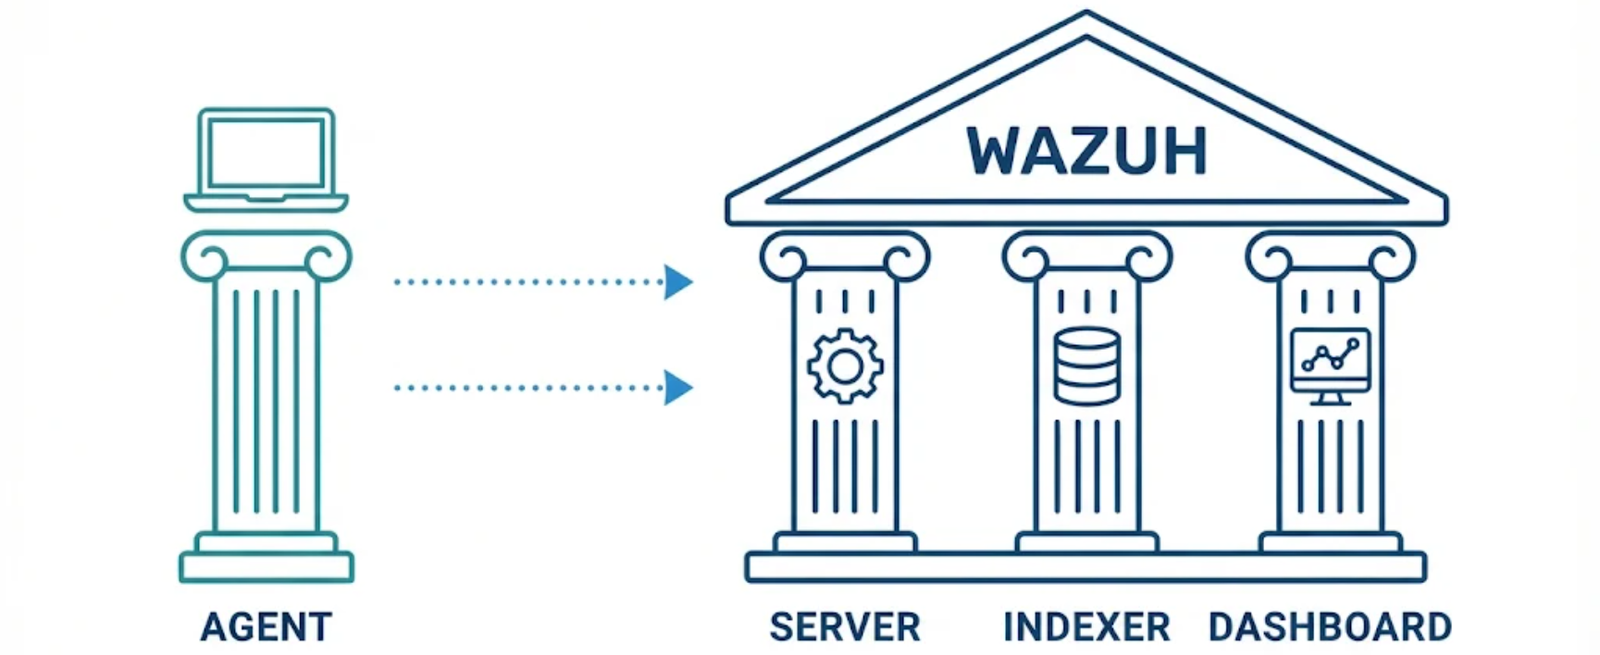
For devices without an agent, such as firewalls, switches, or routers, the server receives syslog. The listener on port 514 is disabled by default; you enable it in the server’s ossec.conf. The agent reads Windows event logs directly via the Event Channel, monitoring the System, Application, and Security channels by default. Additional channels like Sysmon or PowerShell are added as a separate <localfile> block. Winlogbeat is not required for this.
Microsoft 365 integrates with Wazuh via two modules. The office365 module reads activities from the Microsoft 365 tenant, while the ms-graph module retrieves security alerts and incidents from Microsoft Defender as well as Intune audit events via the Graph API. If you also want to fetch Entra sign-in logs via the Graph API, Microsoft requires an Entra ID P1 or P2 license in the tenant.
Wazuh 5.0 is available as a Release Candidate and does not yet have a GA date. The new major version overhauls the architecture: Filebeat is removed, the server writes directly to the indexer, and initial tests from the community show that custom rules from 4.x need to be adjusted.
For an introduction, this means: Start with 4.14 and plan the migration to 5.0 as a separate project once the version is generally available.
additional Wazuh features
Agents are configured centrally via agent groups. A new log source or additional monitoring path is thus deployed to all hosts in the group without having to touch each server individually. Three modules provide information that goes beyond classic log management.

Vulnerability detection
The agent inventories the operating system and installed packages via the Syscollector module. The server compares this list with the Wazuh Cyber Threat Intelligence (CTI). The CTI aggregates data from vendors such as Microsoft, Red Hat, Ubuntu, and Debian, as well as from NVD, OSV, and the CISA catalog.
If an installed version falls within the affected range of a CVE, Wazuh generates a finding. On Windows, Wazuh additionally checks whether an installed hotfix already closes the vulnerability. A patched system thus no longer appears as vulnerable after patch day.
Bewertung der Sicherheitskonfiguration
The SCA module checks endpoint configurations against stored policies, which are primarily based on CIS Benchmarks. Issues like an enabled SMBv1 or disabled audit logging are flagged before an attacker can exploit them. Since misconfigurations can be exploited without any code vulnerabilities, it’s worth regularly addressing SCA findings rather than just monitoring the percentage score in the dashboard.
Dateiintegritätsüberwachung
FIM monitors specified files and directories and reports any changes. After a breach, an attacker typically modifies binary files, autostart entries, or configurations. Therefore, a FIM alert on a server where no one is currently working is an early warning sign. With Whodata enabled, the alert additionally includes the user and the process responsible for the change.
Sizing and Scaling

Overview by agent count (90-day retention)
| Agents | Deployment | Server Nodes (vCPU, RAM) | Indexer Nodes (vCPU, RAM) | Total NVMe Storage |
| 1 to 25 | All-in-One, 1 Host | 4 vCPU, 16 GiB (combined) | on the server host | 100 GB |
| 26 to 50 | All-in-One, 1 Host | 8 vCPU, 16 GiB (combined) | on the server host | 150 to 200 GB |
| 51 to 100 | All-in-One, 1 Host | 8 vCPU, 24 to 32 GiB (combined) | on the server host | 250 to 300 GB |
| 101 to 250 | small cluster | 2 × (8 vCPU, 8 GiB) | 3 × (8 vCPU, 16 GiB) | 600 GB to 1 TB |
| 251 to 500 | medium cluster | 2 × (8 vCPU, 16 GiB) | 3 × (8 vCPU, 32 GiB) | 1.2 to 2 TB |
| 501 to 1,000 | large cluster | 3 × (8 to 16 vCPU, 16 GiB) | 3 to 5 × (16 vCPU, 32 to 64 GiB) | 2.5 to 5 TB |
| 1,001 to 2,500 | Enterprise cluster | 4 × (16 vCPUs, 16 GiB) | 5 to 7 × (16 vCPU, 64 GiB) | 6 to 12 TB |
Storage requirements depend on event rate and retention period. If you need to keep alarms for 180 days instead of 90, roughly expect double the space. These figures are guidelines for the initial setup. After a few weeks of operation, you’ll see the actual event rate per second in the dashboard and can adjust accordingly.
Roles in a distributed cluster
This breakdown shows how a cluster for 100 to 500 agents is composed by machine roles:
| Role | Node | vCPU per node | RAM per node | Disk per node |
| Wazuh server (Master) | 1 | 8 | 8 to 16 GiB | 50 to 100 GB SSD |
| Wazuh server (Worker) | 1 to 3 | 8 | 8 GiB | 50 to 100 GB SSD |
| Wazuh Indexer (Data and Cluster Manager) | minimum 3 | 8 to 16 | 16 to 32 GiB | 300 to 800 GB NVMe |
| Wazuh Dashboard | 1, or on the Master | 4 | 4 to 8 GiB | 30 GB SSD |
| Load Balancer (NGINX or HAProxy) | 1 to 2 | 2 | 2 to 4 GiB | 20 GB SSD |
Why the indexer needs at least three nodes
The Wazuh Indexer is based on OpenSearch. Every decision in the cluster, such as selecting the cluster manager, requires a majority of the voting-eligible nodes. With two nodes, that means both. If one fails, there is no longer a majority, and the remaining node will not accept write operations.
While a split-brain scenario prevents OpenSearch via this very majority rule, high availability is still lost with just two nodes. Only with three or more nodes does a majority of two remain after a failure. At the same time, the cluster can then secure every primary shard with a replica on a different node.
The 31 GiB limit for JVM heap
You configure the indexer heap in /etc/wazuh-indexer/jvm.options. Wazuh recommends allocating half of the available RAM, so for 32 GiB RAM:
-Xms16g
-Xmx16g
Never set the heap above 31 GiB, even if the host has 64 GiB of RAM. Beyond approximately 32 GiB, Java disables Compressed Ordinary Object Pointers (Compressed OOPs). Each object pointer then occupies 8 bytes instead of 4, the heap holds less data at the same size, and garbage collection becomes more expensive.
The second half of the RAM is intentionally left free: The Linux kernel uses it as a filesystem cache for the Lucene segments, which directly benefits searches in the dashboard. To prevent the operating system from swapping out the heap, you also set bootstrap.memory_lock: true in the opensearch.yml.
Load balancer in front of the server nodes
With two or more Wazuh server nodes, agents should be evenly distributed and automatically fail over to another node if one goes down. To achieve this, you place a network load balancer such as NGINX or HAProxy in front of the servers. It distributes event connections on port 1514/TCP across the worker nodes. Agent registration on port 1515/TCP is forwarded to the master node, or agents can connect directly to the master for this purpose.
The server nodes coordinate with each other via port 1516/TCP: The master distributes agent keys, agent groups, its own rules and decoders, SCA policies, and CDB lists to the workers over this port. If a worker fails, its agents are rerouted via the load balancer to the remaining nodes, and analysis continues.
Reading alarm levels correctly
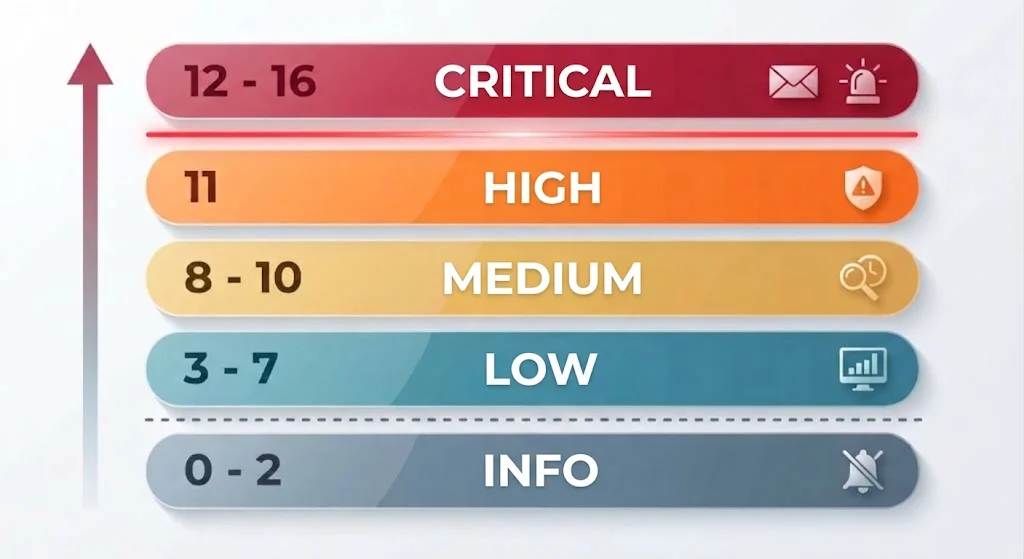
Wazuh assigns each rule a level from 0 to 16.
This level indicates how security-relevant a single event is and thus determines storage and notification.
The official classification is as follows:
| Level | Meaning according to Wazuh | Example |
| ignored | Rule suppresses known false alarms | |
| 1 to 2 | low relevance, system messages | Status messages without security relevance |
| 3 | successful or authorized events | successful login, allowed firewall connection |
| 4 | Low-priority system error | Misconfiguration, unused device |
| 5 | User-induced error | Wrong password, denied action |
| 6 | Low attack relevance | Virus with no effect, frequent IDS events |
| 7 | Keyword match | Message contains 'bad' or 'error' |
| 8 | first observed | first user login, first IDS alert |
| 9 | error from invalid source | login attempt by unknown user, error on admin or root account |
| 10 | multiple user errors | repeated incorrect passwords |
| 11 | integrity check warning | modified binary files, rootkit detected |
| 12 | High-priority event | System or kernel errors and warnings |
| 13 | Unusual high-priority error | Matches a common attack pattern |
| 14 | High-priority security event | Usually triggered by correlation |
| 15 | Severe attack | False alarm virtually impossible |
| 16 | maximum severity | not used by any default rule, reserved for custom rules |
Two thresholds in the ossec.conf determine what happens with these levels. log_alert_level defaults to 3, anything below that does not generate an alert. The email threshold email_alert_level is set to 12 in the included manager configuration, whereas the reference documentation lists 7 as the default. Check the value in your installation before relying on email notifications.
The severity level only provides the basis for escalation—you define the thresholds yourself. A good starting point is this approach: Monitor alarms up to level 7 in the dashboard for trend analysis. Review levels 8 to 10 daily, as they often indicate new logins and brute-force patterns. Address level 11 the same day, since modified binaries may signal a successful compromise.
Starting at level 12, a notification is sent to the on-call team, and levels 14 to 16 trigger your incident response workflow. Adjust the thresholds once you see, after a few weeks of operation, how many alerts are assigned to each level.
Common mistakes during implementation
No target and no use cases
"We need a SIEM because compliance requires it" is not a project goal. Before installation, define which attacks you want to detect: brute force attacks against the VPN, logins from countries where no one in your company operates, changes to the Domain Admins group. These use cases will determine the necessary data sources and rules.
Conversely, those who first collect all logs and then think about what to do with them will fill up storage and generate alerts that no one can classify.
Determine in the same step whether cloud services, Active Directory, or Linux servers pose your greatest risk. This will decide which systems you connect first and how much hardware you’ll need in the initial months.
Not enough time for operations
A SIEM is not a product you set up once and forget. Someone needs to read, classify, and escalate alerts when necessary—and this exact effort is often missing from project plans. After deployment, schedule dedicated time for rule tuning, data source maintenance, and alert analysis. Without it, the rule set becomes outdated, and the team gets used to dismissing alerts with a click.
Gaps in data sources
A SIEM can only detect what it sees. If a critical system’s log is missing, that’s exactly where a blind spot remains. Ideally, you integrate these sources:
- Network devices such as firewalls, switches, and routers
- Servers and clients running Windows, Linux, and macOS
- Cloud services including Microsoft 365, Azure, AWS, and Google Cloud
- Security components like IDS/IPS, antivirus, and Endpoint Detection and Response
- Application logs from databases, web servers, and ERP systems
Endpoints send their data via the agent, network devices via Syslog to the server. If an application provides a log format that Wazuh doesn’t recognize, you write your own decoder. Without a decoder, the lines do end up in the system, but the rules can’t parse fields like user or source IP, so correlation fails.
Default rules without tuning
The default rule set of Wazuh is a starting point but doesn’t know your environment. Running it unchanged either generates a flood of false positives or misses events that are only critical in your network. The result is alert fatigue: the team ignores warnings because most of them are meaningless, and real attacks get lost in the noise.
Three levers help here. You define thresholds to specify how many failed logins within a given time window trigger an alert. Exceptions are set as child rules with level 0, for example for test systems or lab networks where high alert volumes are normal. Correlation rules group multiple similar events from different sources and increase their relevance. Custom rules are added in /var/ossec/etc/rules/local_rules.xml with IDs starting from 100000 to prevent them from being overwritten by updates to the standard rule set.
If your company works remotely a lot, VPN logins and cloud access deserve their own rules. In other environments, off-hours bookings are the critical pattern. In both cases, this separates false alarms from real threats.
Lack of training
An alert is only useful if someone understands it. Those working with Wazuh need foundational knowledge in four areas: log analysis to identify malicious patterns, alert correlation to see connections between events, forensics to investigate systems under suspicion and secure evidence, and attack techniques to classify new patterns.
The MITRE ATT&CK framework helps with the last point, as Wazuh already maps many rules to ATT&CK techniques. Since attack methods are constantly evolving, continuous training should be a fixed part of the annual plan.
Outdated versions and rules
Wazuh releases patch versions in the 4.14 series approximately monthly in 2026: 4.14.6 on July 1, 4.14.7 on July 29, 4.14.8 on September 23, 4.14.9 on October 14, and 4.14.10 on November 5. Version 4.14.8, among other things, hardened path validation and login limits for the server API. Anyone who leaves such updates unattended for months is running a security tool with known vulnerabilities.
In addition to the software, you maintain your own indicators of compromise (IoCs). Wazuh ingests them as CDB lists, such as those containing known malicious IP addresses or file hashes, and matches incoming events against them.
No incident response workflow
A SIEM provides alerts, but no response. To turn a critical alert into a countermeasure, you first need answers to three questions: Who analyzes the alert, and who approves the countermeasures? What steps follow, such as a forensic image or immediate system isolation? Which channel do you use to communicate if your own network is compromised?
Wazuh can execute simple responses on its own. For example, Active Response blocks an attacking IP address on the affected host as soon as a specific rule triggers. For more complex workflows, you integrate a SOAR platform (Security Orchestration, Automation and Response). Shuffle is already included as an integration.
No documentation
Over time, every Wazuh installation accumulates its own rules, decoders, exceptions, and new data sources. Without proper documentation, troubleshooting takes longer, and knowledge becomes siloed with one person. That’s why you should store rules, decoders, and configurations in a Git repository. This way, every change gets a timestamp and a reason, and new team members can clearly see why a rule is structured the way it is.
further points ...
Compliance only claimed
Wazuh provides mappings of its rules to PCI DSS, GDPR, HIPAA, NIST 800-53, and the Trust Services Criteria (TSC), including corresponding dashboards. The documentation clarifies that these mappings are a guideline and do not replace formal certification. There are no pre-defined mappings for ISO 27001 or NIS2. However, you can add your own compliance identifiers to your rules and filter based on them.
This has been relevant for companies in Germany since December 6, 2025: On that day, the NIS2 Implementation Act came into force. Section 30 (2) of the BSIG requires affected entities, among other things, to implement measures for handling security incidents and assessing the effectiveness of their risk management. A SIEM provides evidence for both, but does not replace an information security management system.
Remember data protection. Logs contain usernames and IP addresses, which are personal data. Therefore, define retention periods and implement them in the indexer via policies for automatic deletion, rather than storing alert data indefinitely.
Integration with third-party systems
The Wazuh integrator service provides ready-made connections to Slack, PagerDuty, VirusTotal, Shuffle, and Maltiverse. To connect additional destinations—such as a ticketing system or a Teams channel—you use a custom script, with its name starting with custom-. This way, a critical alert automatically creates a ticket, and follow-up no longer depends on someone actively monitoring the dashboard.
The VirusTotal integration checks the hashes of files reported as new or modified by FIM against the VirusTotal database. Together with the CDB lists and Maltiverse, it supplements your own rules with external threat intelligence.
Community & Support
For questions about Wazuh, the community provides answers in the Slack workspace, the Google Groups mailing list, on Reddit, Discord, and in GitHub Discussions. There you’ll also find developer responses regarding release plans, such as the status of Wazuh 5.0. If you need guaranteed response times, you can purchase professional support, consulting, or training from Wazuh. Additionally, Wazuh Cloud offers a hosted solution where you don’t have to manage servers and indexers yourself.
What makes economic sense
Wazuh doesn’t require a license, but it does demand hardware and man-hours. The payoff comes when an attack is detected early enough to contain it before it cripples production or administration. Add to that the audit evidence you’d otherwise painstakingly gather from individual systems, and the relief for your team when automatic correlation replaces manual log searches.
Conclusion
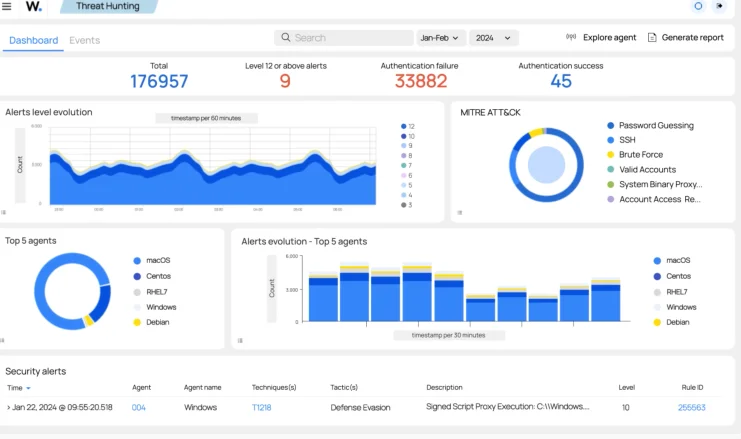
Wazuh is a serious option for companies without their own Security Operations Center, provided someone is allocated dedicated time for tuning and analysis. Start with a few clearly defined use cases, classify alert levels according to the official taxonomy, write your own rules with exceptions and thresholds, and define the escalation path before the first Level-12 alarm hits.
Deploy version 4.xx today and only plan the switch to 5.0 once it’s generally available and you’ve tested your own rules against it.

💬 Comments
0 commentsBe the first to start the discussion with a helpful comment.
Leave a comment
Comments are reviewed briefly before they are published — factual, respectful and to the point is just right here.